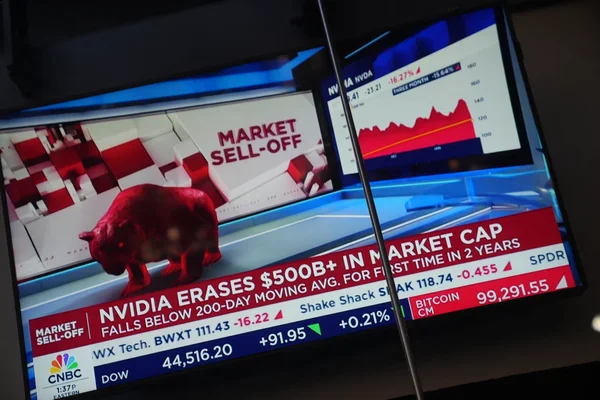
Monitor Iran, the midterms, and global macro, live.Explore Situation Rooms
Developer Console
Sign in to manage API keys.

Calibrated foresight, grounded in capital

A continuously updated causal model of world state. Ask any question and get a streamed probability with the drivers and markets behind it.

pb ask --question="If China blockades Taiwan by 2027, will the US impose Russia-level sanctions by 2028?"
reasoning across 12 source markets · 5 chains · Polymarket, Kalshi
calibrating prior · resolving uncertainty band
p = 26% (range 18 - 35%)
confidence chain assembled · 12 markets, weighted

Ask any question about the future

Get back an answer you can act on, with the markets and drivers behind it.

Forecast accuracy improvement

10%

Walk-forward backtests across 17 assets. Median improvement over industry-standard volatility forecasting models across equity, rates, FX, and commodities.

Explicit causal reasoning

We fuse market data with news, and your own private sources, then apply an explicit causal model to answer questions no single market prices, including conditional and counterfactual ones.

Auditable probabilities

Streamed probabilities with a full audit trail, traceable to the contributing sources and weighted by confidence.

Explore Situation Rooms
Backed by
20VCHarry Stebbings, Kieran Hill
KDXAshby Monk, Elliott Donnelley
Carles ReinaElevenLabsBaobab
Charles ClancyCTO, MITRE Corporation
Six years of cascades

World events are connected

Empty Times Square, NYC — night, no people
March 2020

COVID → Supply Chain Issues

lockdownssupply chains breakstimulus surgeinflation returnsrates reset
Russian armored column crossing border — overhead drone shot
February 2022

Russia Invades Ukraine → Energy Shock

war shockenergy spikefood pricesEuropean stressglobal inflation
Powell at Jackson Hole podium — close, serious expression
November 2022

Fed Pivot Credit Tightens

rate cycle peaksterminal rate repriceddollar whipsawcredit tightensgrowth fears
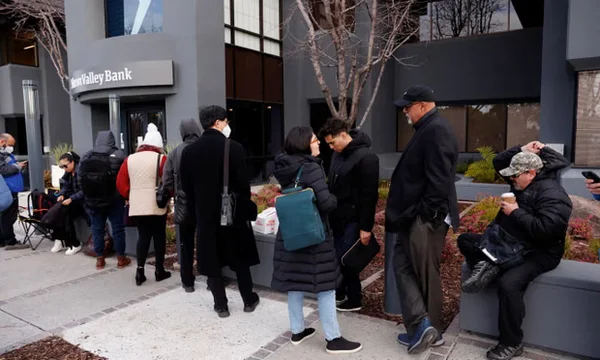
Queue outside SVB Santa Clara branch
March 2023

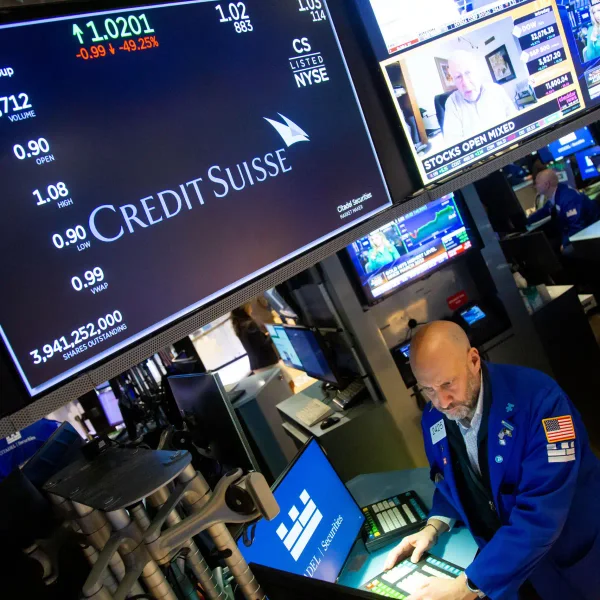
SVB → Credit Suisse → Credit Crunch

deposit flightbank contagionpolicy backstopcredit crunchrecession risk
Trump on stage following election victory
November 2024

Trump Returns Tariff Risk

second termtariff threatsupply chains repriceinflation riskdollar strength
DeepSeek app store chart going vertical — screenshot
January 2025

DeepSeek Tech Sell-off

model shockGPU demand questionedNvidia drawdownAI capex repricedpower demand reset
Tanker under naval escort in the Gulf — wide shot
February 2026

Strait of Hormuz Crude Spike

chokepoint riskshipping premiacrude spikeinflation path shiftsEM stress
NYSE trading floor celebration — traders, screens
June 2026

S&P 500 ATH

What happens next?

Book a demo

PolyBridge Features

170,000+
markets searched

Ask beyond any single market

Ask any question about the future. PolyBridge searches across markets and venues to answer questions no individual market covers.

Probability with uncertainty

Get a calibrated probability with an uncertainty range, not just a single number.

Traceable reasoning

See the events and signals driving the result, follow the evidence trail, and inspect the exact source markets and venues used.

Scenarios, live updates and alerts

Change assumptions to see how probabilities move, track updates as markets change, and set thresholds for notifications.

Adjust an input. See the downstream effects

Ask
Ask

If the Fed holds in September, what happens to emerging-market sell-off probability?

The engine works across 170,000+ markets and returns a quantitative answer with every contributing market visible.

62%
48 – 75% · 14 markets

The interface

Forecast

A probability you can act on

Every answer is a precise number with a credible interval. The interval widens when market evidence is thin, or stale, and narrows when it is strong.

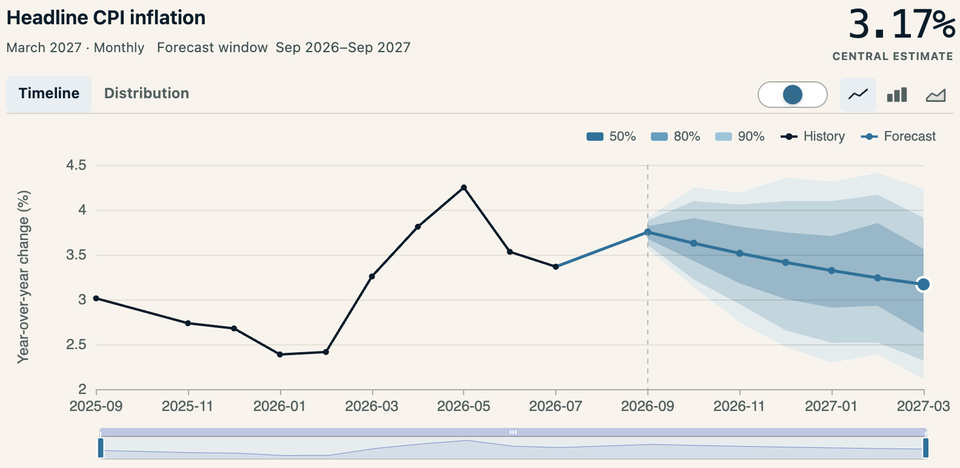
Probability over time chart with calibrated probability line and confidence band
Source markets

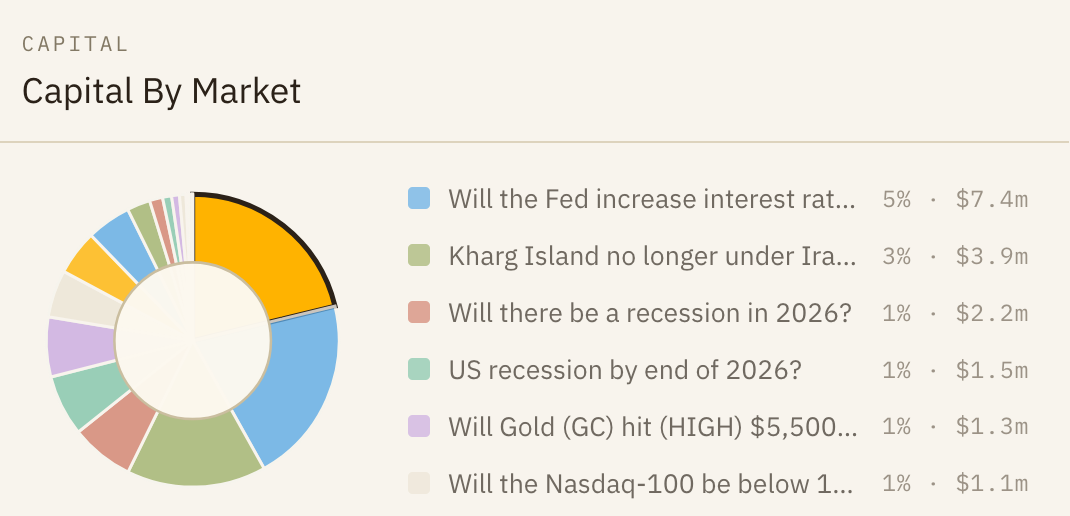
$151.8m in real capital backing this answer

Each probability traces to the markets that informed it, weighted by liquidity, where real capital is at risk.

Capital-by-market donut chart showing $151.8m backed across source markets
Drivers

31% Credit Stress. 19% Geopolitical Escalation

Each driver is a node in the causal model. Condition on it, intervene, or test a counterfactual.
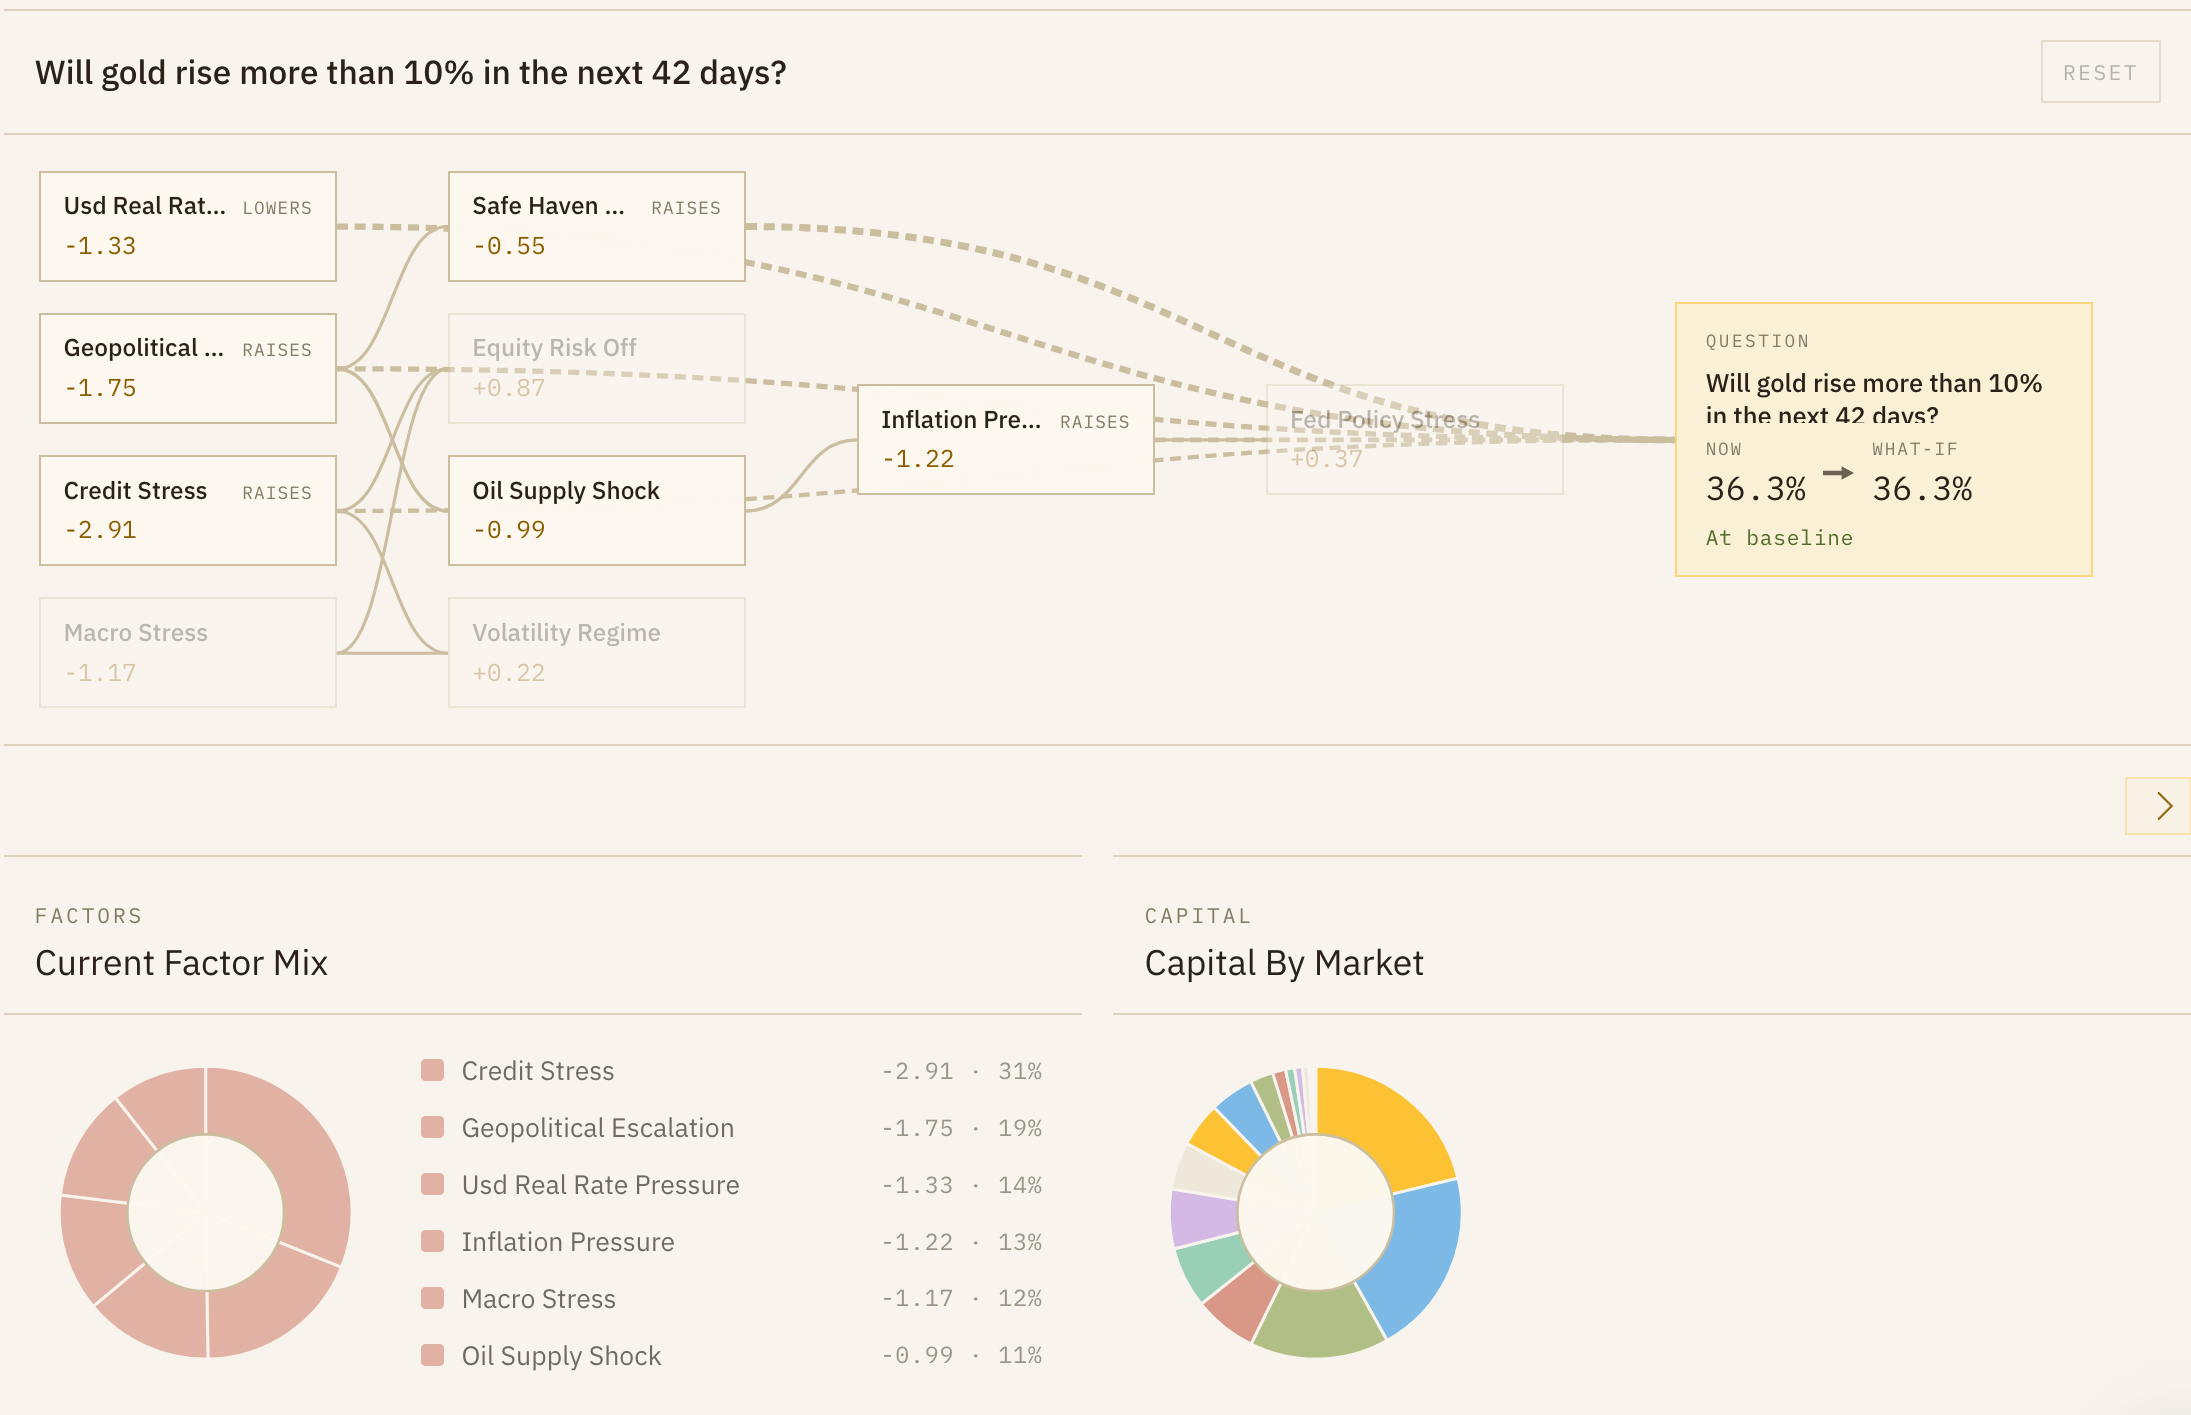

Forecast interface showing causal graph, factor mix, and capital by market panels
FAQ

Common questions

How PolyBridge fits into forecasting, monitoring, and decision work.

PolyBridge returns streamed probability distributions. Uncertainty is explicit. Causal drivers behind the result are reported. Quantitative answers are traced back to source data, from prediction markets and other sources.

Yes. PolyBridge answers have mechanistic explainability by design, rather than narrative explainability.

The volume and number of event contracts on prediction markets is growing, but the number of questions will always be finite, unlike the number of questions worth answering. This is a gap PolyBridge fills.

LLMs excel at providing compelling narrative, whereas PolyBridge returns streamed quantitative probabilities conditioned on markets. The use cases are different and complementary.

PolyBridge maintains a continuously updated latent model of world state. It's mechanistically interpretable and supports do-calculus on named concepts.

We are continuously adding new data sources, which improves model calibration with every resolved event.

Markets aggregate the views of many participants, including other models, into a price. The best models who have an edge are incentivised to participate and publish their otherwise private information. That makes them the most efficient single place to start.

No, this is the problem PolyBridge causal world model solves. Generalisation to low and no liquidity regimes.

Every answer is a structured probabilistic output. It contains:

  • A calibrated probability with a confidence interval. A range that reflects uncertainty, sized to the strength and freshness of the underlying evidence.
  • An evidence trail. Each connection is legible. You can see which upstream events drive the answer and by how much.
  • Source markets with contribution weights. Every market that informed the answer is named, with its influence shown explicitly.
  • A public-data prior, separate from market signal. What historical reference data implies versus what live markets are pricing. Divergence between the two is shown.
  • Support and freshness metadata. How many resolved historical examples back the estimate, and when the underlying data was last updated.

This structure means every answer can be reviewed and defended.

Additional documentation is available to qualified institutions upon request. Contact PolyBridge

Teams making high-stakes decisions under uncertainty across defense and intelligence, long-horizon investing, financial services, energy and commodities, and corporate strategy. They use Situation Rooms to monitor live crises, the Forecast Interface to stress-test decisions, and the API to embed foresight into their own systems.

Request access for Situation Rooms, the Forecast Interface, Search, Forecast, and approved RVOL data endpoints, agent workflows, or other PolyBridge tools.

Put foresight to work.

For institutions

Get access to PolyBridge Forecast Interface.

For developers

Explore the PolyBridge APIs.