
Google released TimesFM-3 in August: a zero-shot foundation model for multivariate forecasting, first on the GIFT-Eval, fev-bench and TIME benchmarks. TimesFM-3 uses future covariates to help guide the forecasting. PolyBridge’s causal world models also use future covariates to compute a market-implied consensus of the future. PolyBridge primarily uses market data and historical data sources, but we are also interested in the potential of models to enter as an additional evidence stream. TimesFM-3 is a natural candidate here, so we were curious how it does on a handful of variables we care about. We generated forecasts for seven US macroeconomic indicators with both models and scored them. We chose macro indicators where there are standard public baselines to compare against, so that we could assess both relative and absolute performance between the two.
Our experimental design was simple: perform standard walk-forward simulations with information cut-offs enforced at each forecasting time-period to prevent information leakage. For each macroeconomic indicator, we made forecasts at several horizons with PolyBridge and TimesFM-3, using only information available at the time of forecast and compared them to an industry baseline. The exact same data is inputted to both PolyBridge and TimesFM-3.
The Headline CPI YoY forecast is shown in Fig 1, and Fed Policy stance is shown in Fig 2. The figures show one forecast horizon: one month ahead for Headline CPI and two months ahead for Policy Stance.
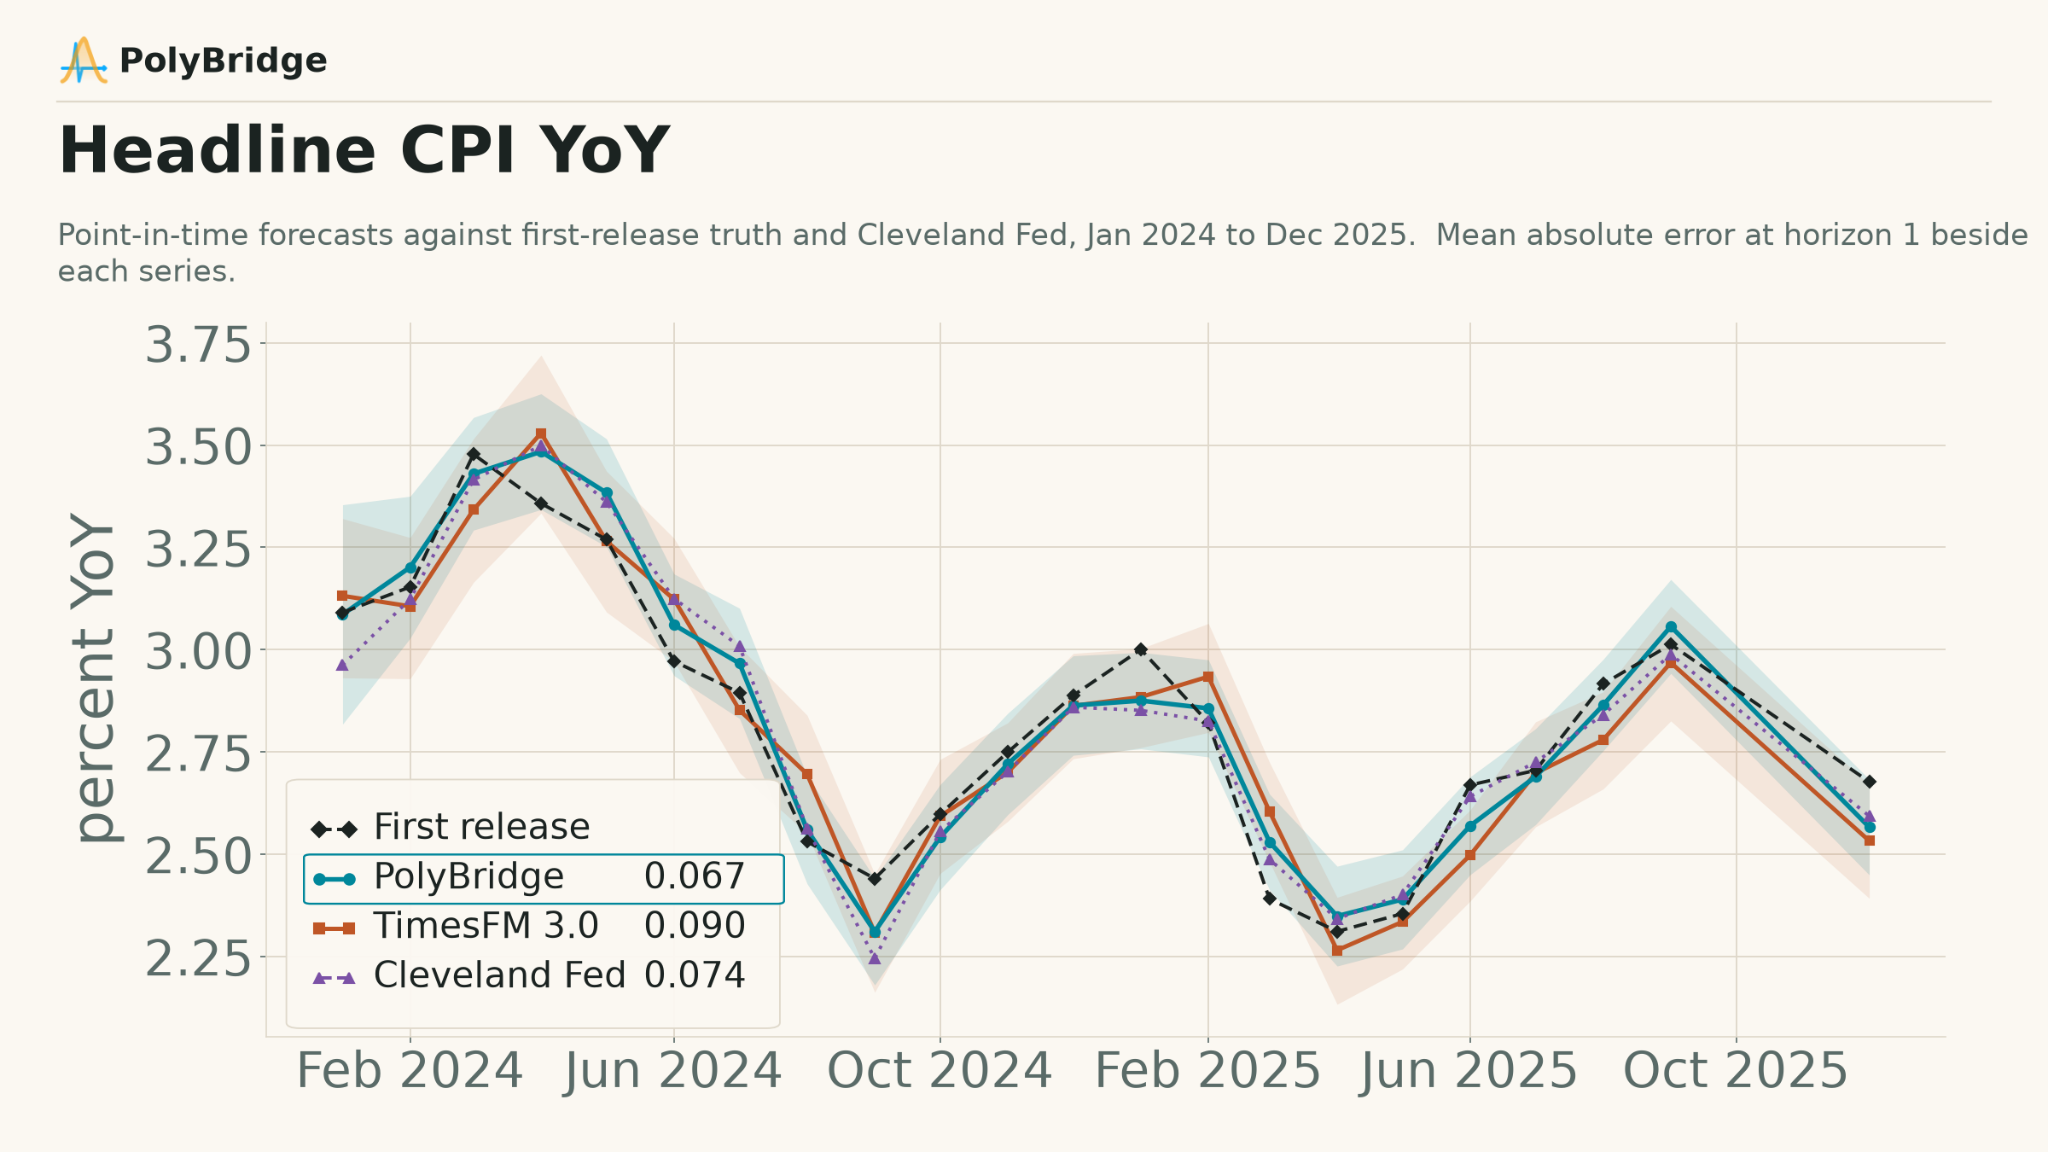
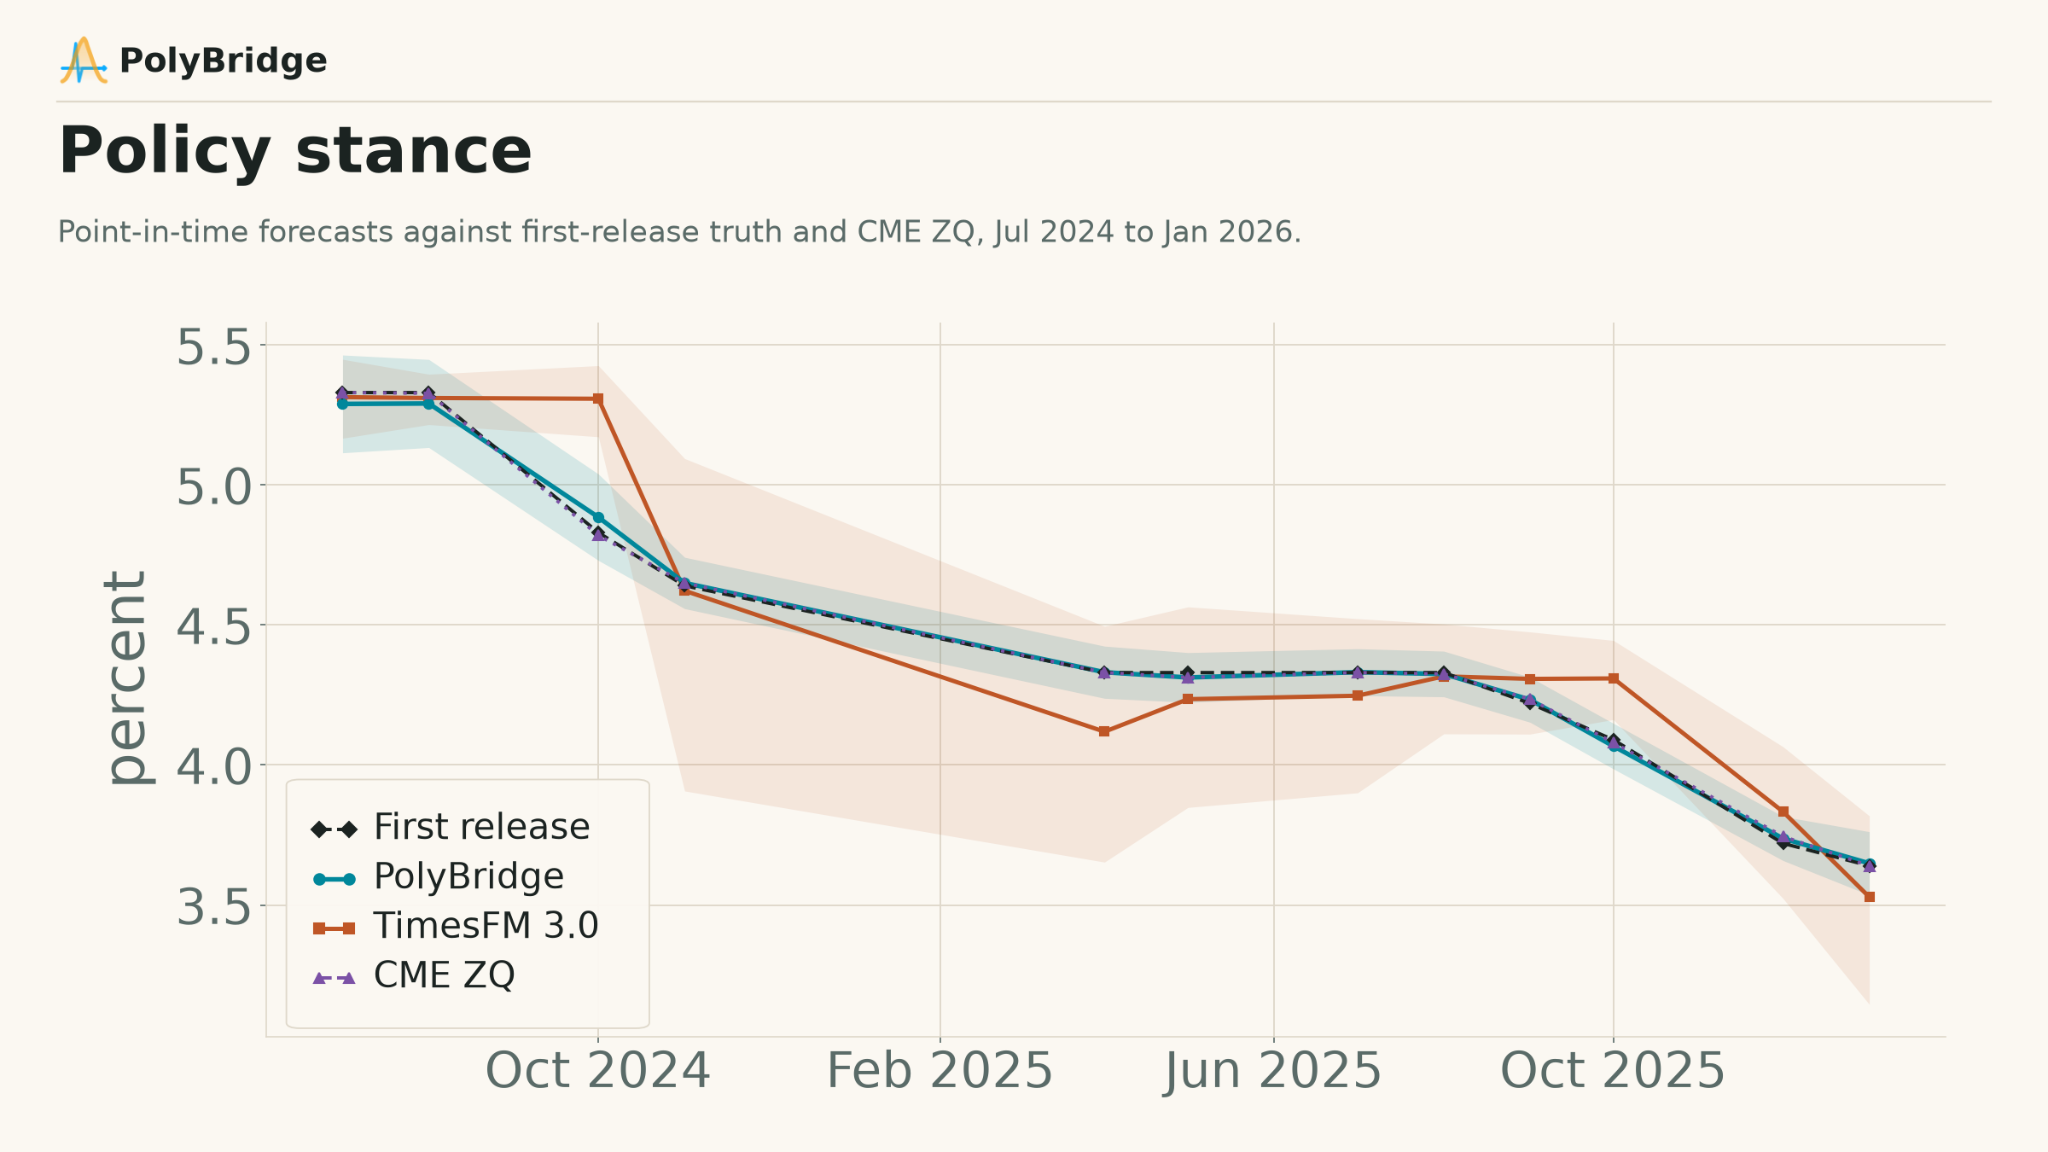
Tables 1 and 2 summarize the seven comparison sets across the tested horizons. The tables report mean absolute error (MAE) for point accuracy and continuous ranked probability score (CRPS) for probabilistic accuracy. Lower scores are better.
| Target | Public reference | PolyBridge MAE | TimesFM-3 MAE | Public reference MAE |
|---|---|---|---|---|
| Headline CPI | Cleveland Fed | 0.0855 | 0.0978 | 0.0901 |
| Core CPI | Cleveland Fed | 0.0902 | 0.1175 | 0.0859 |
| Unemployment | Fannie Mae | 0.1054 | 0.1277 | 0.1139 |
| Payroll growth | Fannie Mae | 34.69 | 57.67 | 43.18 |
| Housing starts | Fannie Mae | 0.0534 | 0.0472 | 0.0563 |
| GDP growth | Fannie Mae | 0.9418 | 1.1921 | 1.1667 |
| Policy rate | CME ZQ | 0.1349 | 0.4806 | 0.1462 |
| Target | Public reference | PolyBridge CRPS | TimesFM-3 CRPS | Public reference CRPS |
|---|---|---|---|---|
| Headline CPI | Cleveland Fed | 0.0588 | 0.0702 | 0.0901 |
| Core CPI | Cleveland Fed | 0.0646 | 0.0819 | 0.0859 |
| Unemployment | Fannie Mae | 0.0774 | 0.0869 | 0.1139 |
| Payroll growth | Fannie Mae | 28.47 | 42.26 | 43.18 |
| Housing starts | Fannie Mae | 0.0375 | 0.0340 | 0.0563 |
| GDP growth | Fannie Mae | 0.7567 | 0.8616 | 1.1667 |
| Policy rate | CME ZQ | 0.0997 | 0.3365 | 0.1462 |
*Note: Public references are scored as point forecasts; their CRPS therefore equals MAE.
PolyBridge scores better than TimesFM-3 on 6 of the 7 targets, and better than the public reference on 6 of 7. It loses on core CPI to the Cleveland Fed and housing starts to TimesFM-3.
More interesting to us than the ranking is how different the two models' errors are. Figure 3 reports the correlation between PolyBridge and TimesFM-3 forecast residuals on the same forecast cases.
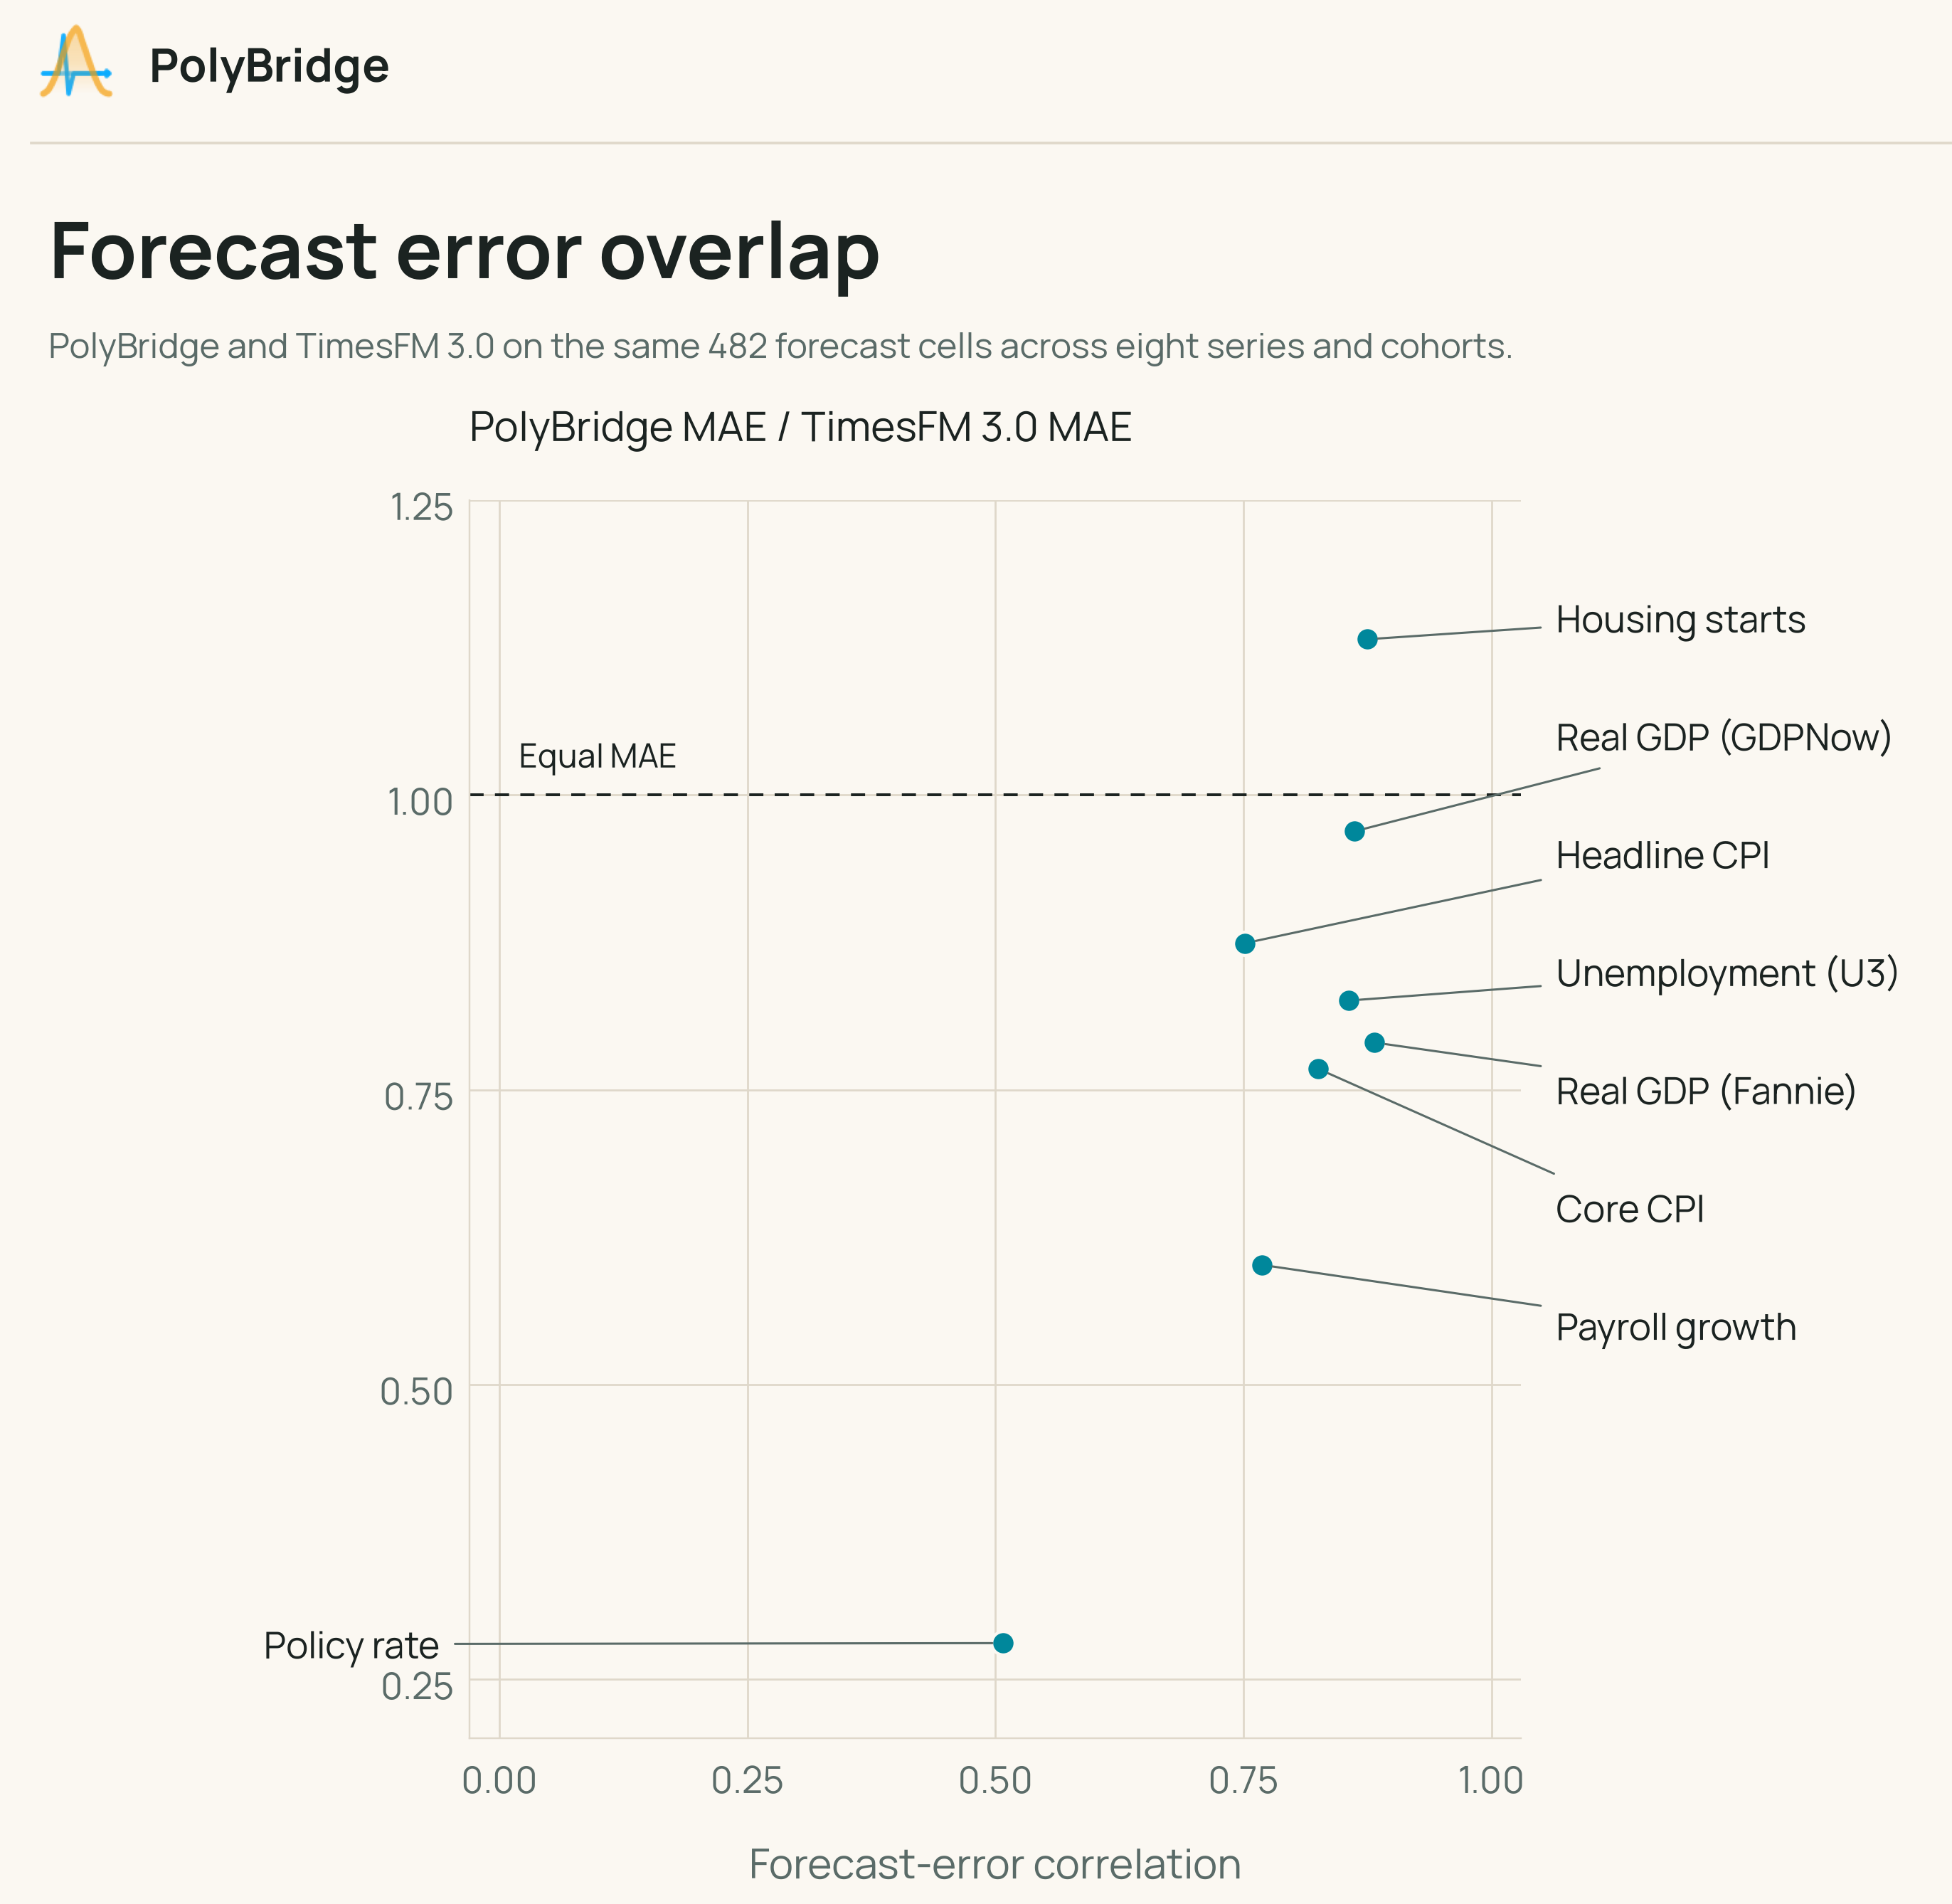
Where residual correlation is low, the two models are wrong at different times, which is a condition under which fusing them is likely to yield a better joint forecast: for two forecasters with similar error variance and residual correlation ρ, even a naive equal-weight average reduces error variance by a factor of (1+ρ)/2. Given the correlation is fairly similar, we expect a modest improvement from evidence fusion. Something to quantify later in a follow up.
Beyond accuracy, the two models are built differently. TimesFM-3 is transformer based, whereas PolyBridge generates a probabilistic graphical model of the 'world' in which the question lives. In PolyBridge, there's a graph of named economic concepts, with directed relationships between them. Every forecast therefore has explicit reasoning: understanding, not just a number, is our philosophy.
More precisely, PolyBridge’s models allow you to answer five questions valuable for thoughtful quantitative decision making:
- Filtering - What is happening now?
- Forecasting - What is likely to happen next?
- Conditioning - How should new evidence change that assessment?
- Interventions - What follows from the contemplated action?
- Counterfactuals - What would likely have happened under a different course of action?
So, when an investment committee goes beyond asking "what is the growth forecast", and asks a question such as, "what happens to growth, if financial conditions stay tight through the end of 2026?". PolyBridge can answer that with a calibrated distribution.
In one model scenario, we set the Chicago Fed’s National Financial Conditions Index (NFCI) to +1.0 from September through December. That level represents financial conditions one standard deviation tighter than their historical average. Under this scenario, the model’s estimated probability of March 2027 real GDP growth falling below 2% rises from 47% to 57%. The model propagates the effect through retail sales and industrial production.
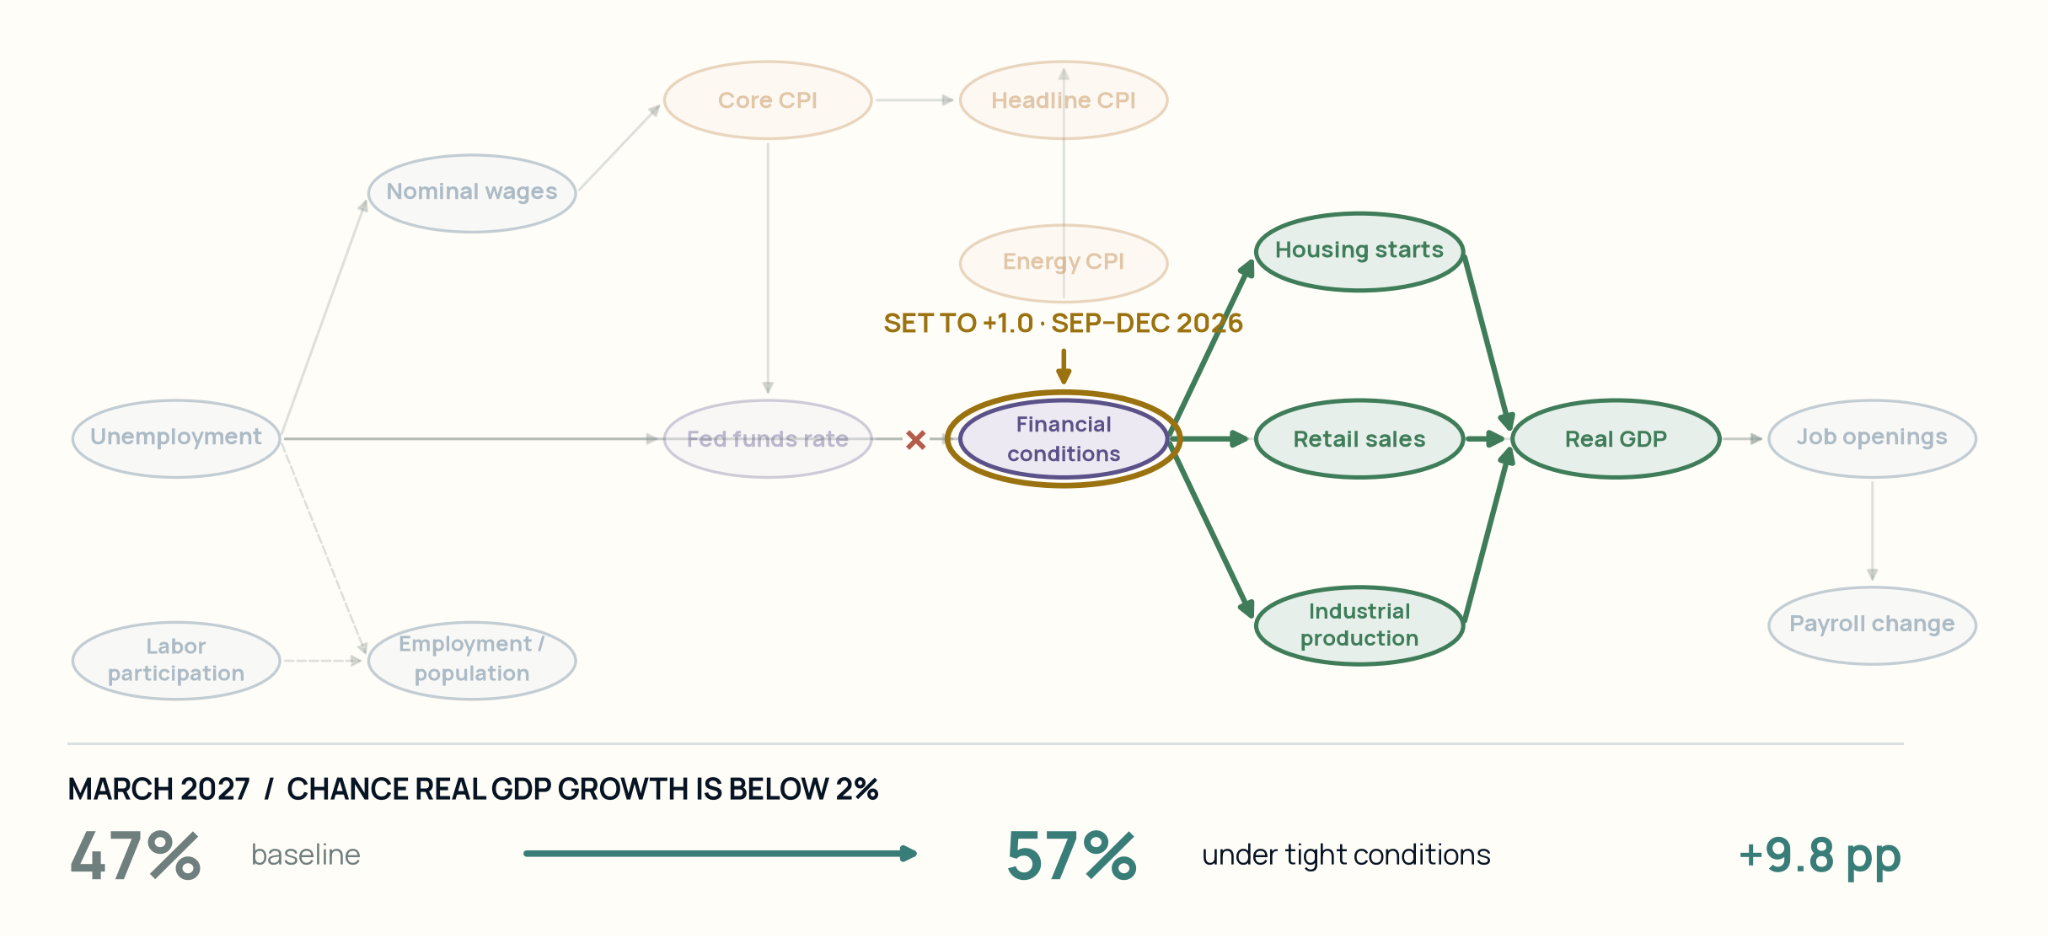
Because PolyBridge represents the economy’s structure, it can make these kinds of interventions to answer what-if questions for different paths the economy might take. In each scenario, all assumptions are explicitly stated, and all conclusions can be traced step by step back to the underlying evidence. The follow-up will report what changes when TimesFM-3 is added to this model as a data source. To run your own scenarios against similar economic models, reach out to: [email protected]