ExportsLive odds propagated. Largest 90% export interval reaches +1.9pp. Top median lifts: Spain.
+0.8 to +0.8pp PolybridgeSituation rooms
The World Cup's Other Scoreboard
A World Cup result does not stop at the final whistle. Polybridge forecasts where it lands in the economy.
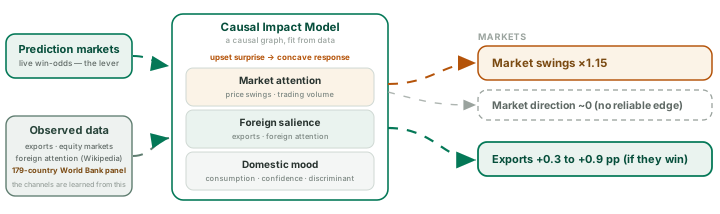
Exports if they win+0.8 to +0.8pp
Equity volatility
Headline readouts
VolatilityFixed aggregate volatility readout. Next-day interval: x1.05 to x1.27.
CalibrationHeld-out 90% coverage for export and volatility checks.
90.5% / 87.1%Export Lift By Winner
Additional two-quarter export growth after a championship, in percentage points.
Manufactures export share73%
+0.8pp+0.07pp to +1.85pp
Equity Markets
Volatility response
The post-match volatility bump is outcome-independent: the market gets louder, but the result does not reliably pick a direction.Next day
x1.05 to x1.27
1 week
x1.03 to x1.16
1 month
x0.82 to x1.18
Directional return response
Weakly-informative prior — the published Edmans-Garcia-Norli -0.5% elimination effect is folded in only weakly, so the WC data dominates. do(win) / do(loss) / do(elimination) all come out ~0: no reliable directional edge. Consistent with Gatto (2026), who finds no day-after return effect in liquid markets. Reported as a distribution.Win~0
-9.9 bps to +14.0 bps
81.8% within +/-10 bpsOrdinary loss+18.0 bps
-1.8 bps to +38.0 bps
24.6% within +/-10 bpsElimination~0
-27.0 bps to +19.3 bps
50.3% within +/-10 bpsHow a Win Moves Through the Economy
The graph summarizes the evidence structure: prediction markets provide the football input, observed data fit the channels, and the room reads out exports and market volatility.