
How likely is stagflation? A joint picture
Stagflation is important because low growth hits equities, and inflation and policy response hits bonds. Both legs moving together kills diversification, upping portfolio risk.
- By
- PolyBridge Research
- Topic
- US macro
- Date
- Reading time
- 5 min
Geopolitical shocks reverberate through the entire economy. Recent disruptions to Middle Eastern energy routes show how much geopolitical events can affect oil prices and the wider economy. Rising energy costs can increase headline inflation while simultaneously dragging down employment, creating a stagflation scenario. The Fed may respond by raising interest rates, but this risks pushing unemployment even higher.
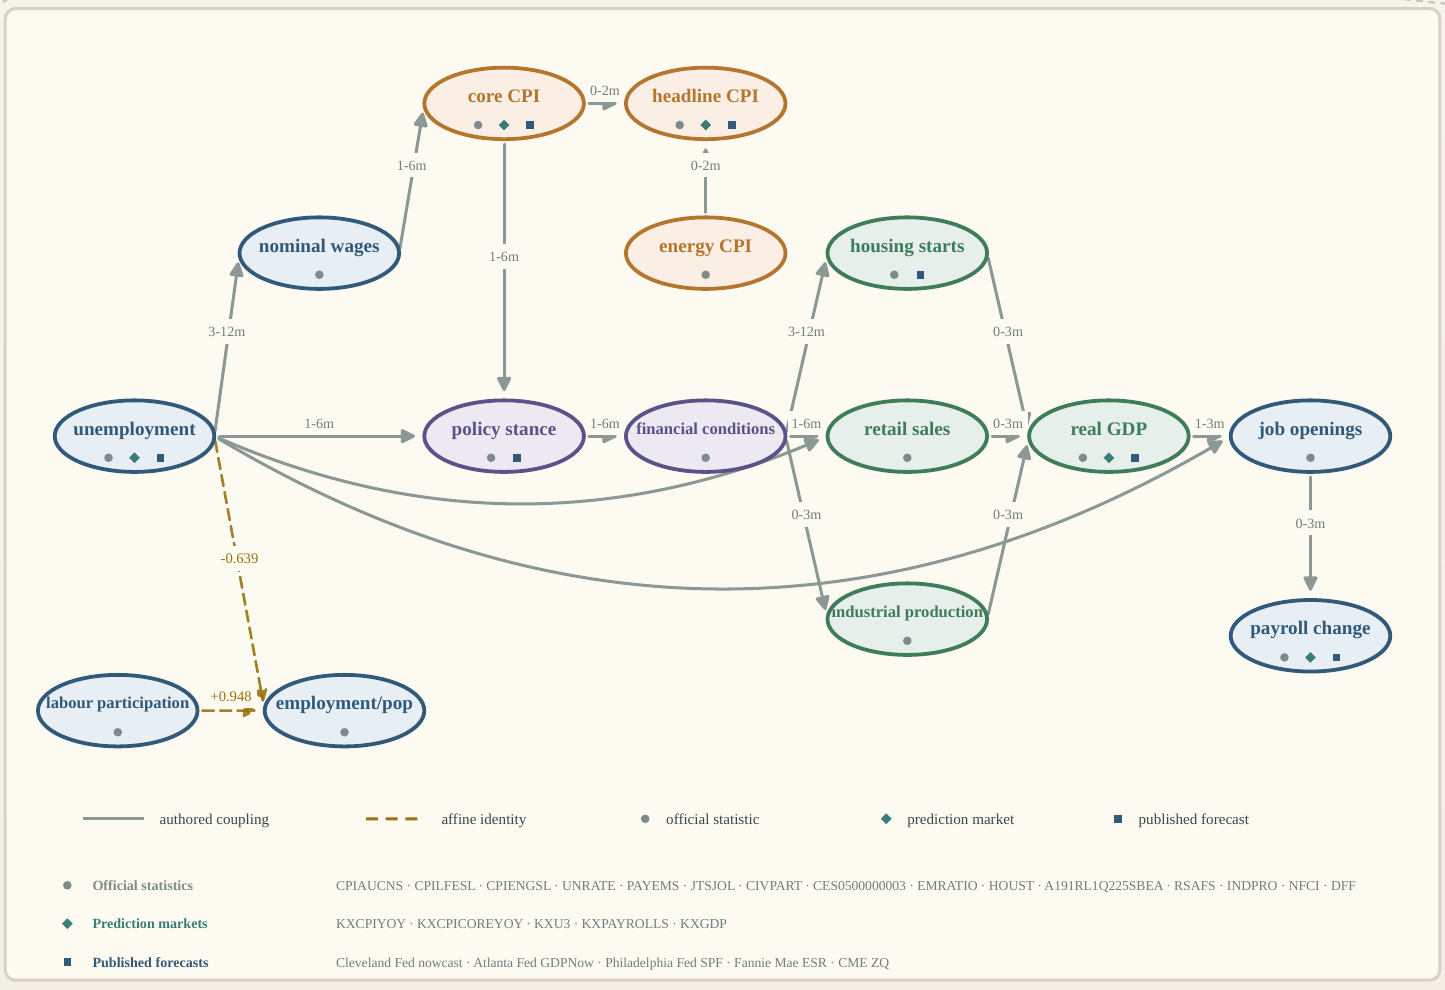
PolyBridge’s US macro situation room models these relationships explicitly. It maps named concepts, such as core, food and energy inflation, unemployment, wages, growth, the policy rate and financial conditions onto a causal graph. This is shown below in Fig. 1. Official statistics, nowcasts, market prices and published forecasts are used to inform the model.
Together, these inputs produce one joint probability distribution over the macroeconomy, rather than disconnected point forecasts. We can then use this joint distribution to monitor and interrogate economic phenomena like stagflation.
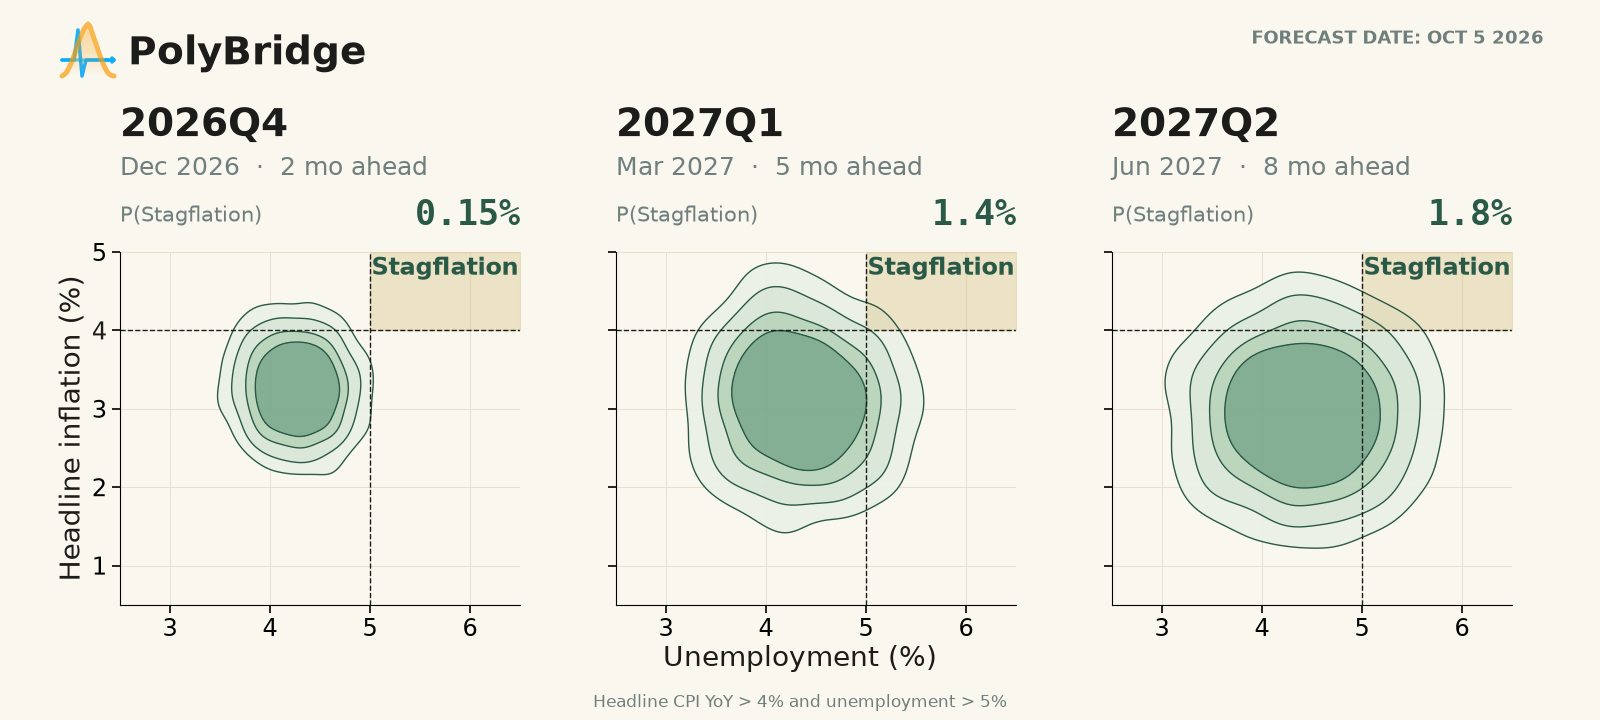
Inflation and unemployment provide a useful example because their joint behavior matters for policy, markets and investment decisions. Consider the stagflation condition: P(Headline CPI > 4%, U3 > 5%). The video below shows how our stagflation outlook from 2024 onwards has evolved. The contours show the probability of the joint event, and the shaded upper-right region identifies the stagflation region.
The distribution updates as new evidence is ingested by the model. In these snapshots, the estimated probability of entering the stagflation zone fluctuated. It reached 5.1% in the May 2026 retrospective forecast, fell to 1.3% in the August forecast, and was 1.7% in the September forecast. The important feature is that the dependence between inflation and unemployment is preserved by the model. Looking at both together we find stagflation is a tail scenario. And monitoring inflation and unemployment separately can overstate the risk because it ignores how rarely both thresholds are crossed together.
Here is a snapshot of our stagflation projections as of Oct 5, 2026.
From an outlook to a decision
A joint model lets an analyst or investment committee ask more than where inflation goes next. It can estimate the probability of a regime, condition on new evidence, or evaluate a policy intervention while holding the rest of the model fixed. For example:
How does the stagflation probability change if oil rises?
What does a different policy-rate path imply for growth and unemployment?
Which evidence moved the forecast, and by how much?
Answers are quantitative, and update as market prices and economic releases move. Questions can be asked in natural language, but the resulting probability is computed by the fitted structured causal model, not an LLM. Every answer carries uncertainty and traces to the evidence and model version that produced it.
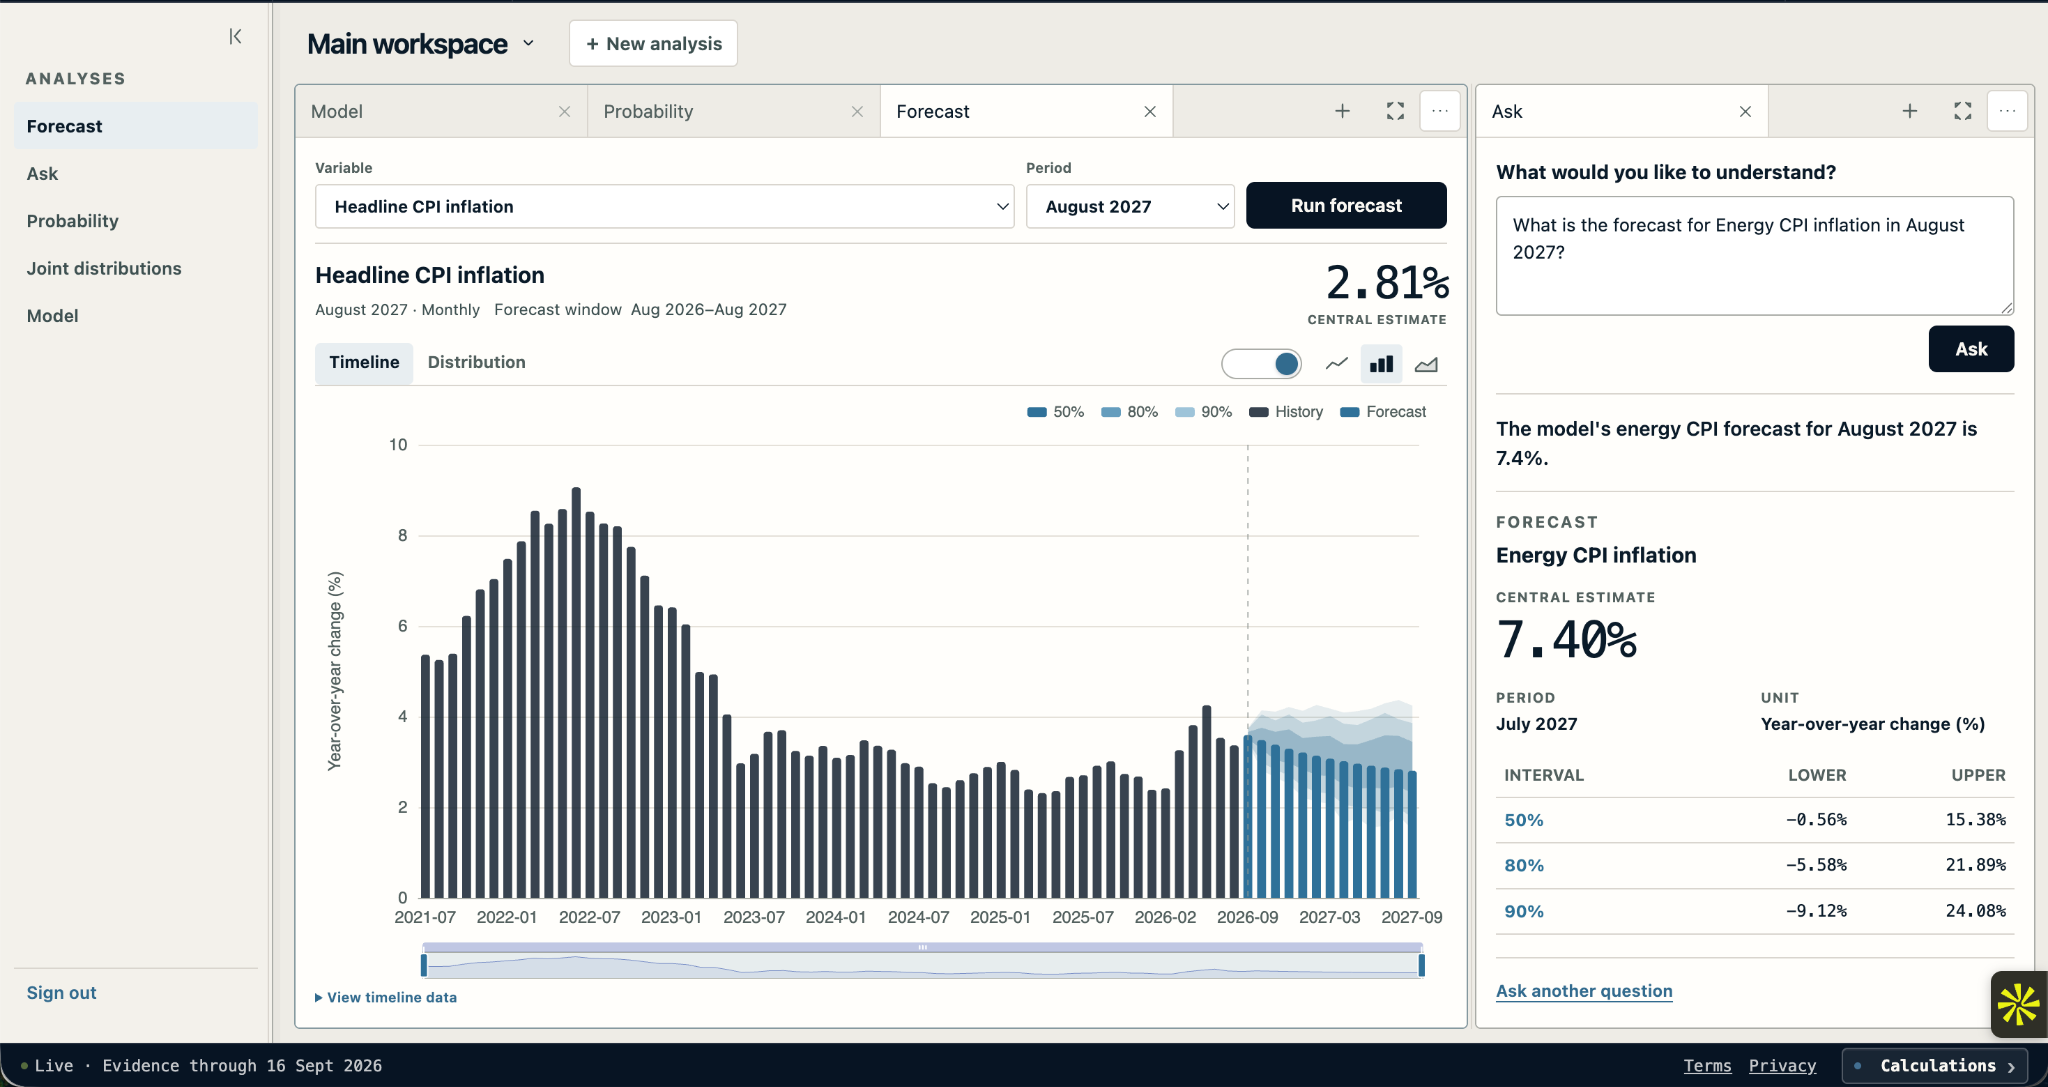
The PolyBridge console is one way to ask these questions. The same functionality is available through our API or MCP server.
PolyBridge builds causal world models for questions that do not fit neatly into a single market or point forecast. To explore the US macro situation room, contact us at polybridge.ai.